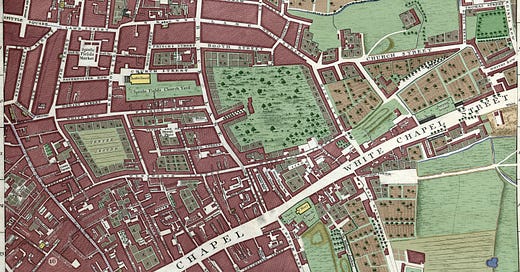
London's East End in Colour, 1746
A Georgian map of Whitechapel, Shoreditch and Spitalfields, coloured for the first time.
Welcome to Londonist: Time Machine, the newsletter of London history.
Today, we’re back with the maps of John Rocque, and my ongoing project to colour in all 24 panels from his 1746 masterwork. This time, we’re in a part of town that most Londoners (and visitors) will be familiar with: the near East End. To get your bearings, Whitechapel Road is the diagonal line to bottom-right, while Shoreditch High Street runs vertically in the upper-extreme-left. The quadrant in-between contains the ever-popular Brick Lane, Petticoat Lane and Spitalfields Market.

You’re seeing this map of Georgian Spitalfields as no one has seen it before — in colour. As with the previous nine instalments in this series (see below), I’ve taken part of a black-and-white map of 1746 and painstakingly added colour.
Before we dig into the detail, here’s a bit of background for those who are new to the project (skip the next section if you’ve read this before):
What this is, and why I’m doing it
John Rocque’s 1746 map was by far the most detailed survey of London up to that point. Across its 24 sheets, you will find the names of thousands of alleys, wharves, lanes and landmarks, mapped in a clear, consistent style. And all of it was done for the first time with (reasonably) accurate surveying methods. It is, quite simply, one of the great treasures of London.
I’m adding colour to this previously black-and-white map for several reasons:
(1) It helps us to see the patterns of land use (urban versus agricultural versus marsh and moor and meadow). It also reveals the hidden watercourses, City ward boundaries, churchyards, parterres, partitions and plantations that made up the 18th century city. All this information is on the black and white original, but it’s much easier to distinguish with a bit of colour.
(2) It’s a lot of fun to spend many hours poring over my favourite map and, I suspect, I’m getting to know it better than anyone alive. That means I might spot a few details that have been missed before.
(3) It amuses my kids to know that daddy likes colouring things in as much as they do.
I’m going to let the map do most of the talking in today’s newsletter. Explore it at your leisure and see what you can discover. But I would like to pick up on a few highlights below. I suggest you have a copy of the map open in a separate tab or on another device, so you can alternate between the map and the commentary.
Georgian Spitalfields, Whitechapel and Shoreditch
We’re looking at an East End very different to the one known to tourists today. No fashion shops, no street art, no pop-up matcha bars or cupcake vans or curry houses, and definitely no Jack the Ripper tours.
This was the land of the silk weavers. Hundreds of Huguenot refugees had settled here from the late 18th century, fleeing religious persecution in France. They brought few possession, but plenty of weaving skills. Very soon, Spitalfields became famous for its silk industry. Those handsome terraces that still grace the area today were almost all occupied by silk weavers at one time or another. We can even detect the Huguenot presence on Rocque’s map. Look north-east of ‘Christ’s Church’ in the south-west section, and you’ll see two smaller yellow rectangles marked ‘Fr. Ch’., implying French church. The most southerly of these, at the end of Church Street (now Fournier Street) would go on to become a synagogue, after Jewish immigrants arrived in the second half of the 19th century. Today it is a mosque. Few buildings can claim to have served three religions in this way.

Brick Lane is already built up along its entire length by 1746. The name recalls a time when the land hereabouts was used for excavation of earth for brick making. East of this famous street, however, much of the map is empty of development, a patchwork of grazing fields, market gardens and other cultivated land.
Usually, I have much to say about the water in these maps. Most of the previous instalments have featured a torrent of streams, ponds and irrigation channels. We see damp patches here and there, but perhaps not as much as on other panels. No trace of any of them remains, as far as I’m aware.
In contrast to several areas we’ve seen, this panel shows a street plan that differs greatly from the modern map. The 19th century highways of Commercial Street, Commercial Road and Bethnal Green Road have yet to carve up the neighbourhoods (although the essence of Bethnal Green Road can be discerned in the wide track heading east towards the top right). The numerous railways that now cut through the area are more than a century away. This section was bombed intensively in the Second World War, with old terraces often replaced by housing estates, thereby deleting old street patterns. Meanwhile, the roads that do remain have often changed name. The well-Instagrammed cluster of roads with the old houses, near Christ Church Spitalfields, are today known as Hanbury Street, Princelet Street, Fournier Street and Wilkes Street; in 1746, they were Browns Lane, Princes Street, Church Street and Wood Street. The combined effect is discombobulation; familiar territory with unfamiliar routes and labels.
Then there’s Petticoat Lane. This is an oddity. The road carrying this famous clothes market changed its name to Middlesex Street more than 200 years ago. Yet we still call it Petticoat Lane thanks to the persistence of the market. London has a long memory.
My tip, to get your bearings, is to look at the churches in yellow. Most of these remain major landmarks today. St Leonard’s, top left, still presides over its Roman-era junction. St Matthew, towards the north-east, also stands proud, though no longer isolated in fields. Christ Church, the most awe-inspiring of Hawksmoor’s churches, continues to dominate the skyline of Spitalfields. The one exception is the church at bottom-centre. St Mary’s was the original ‘white chapel’ that gave the area its name, thanks to the chalk-and-lime whitewash of the medieval original. A Victorian replacement was destroyed in the war, though its footprint can still be traced in Altab Ali Park.
As ever on the Rocque maps, the careful eye will spot any number of curious names among the warren of byways. Jane Shore Alley off Shoreditch High Street remembers a mistress of Edward IV who, in folk etymology if not actuality, gave her name to Shoreditch. The short street labelled only as ‘Gibraltar’ (top centre) recalls a local pub of that name, which survived into living memory. Fashion Street (below Christ Church) still exists; it is named after its developer, Thomas Fossan, rather than any sartorial connection to the nearby silk trade. And I love the trio of alleys off Shoreditch High Street known as Hair Alley, Cock Alley and Dirty Lane. I could weave a delicious origin story for that combination, but I’ll leave that to your own filthy imagination. Dirty Lane, incidentally, today coincides with Boundary Passage which, judging by an unofficial nameplate, has preserved its insalubrious reputation:
A note on trees
You know what the killer was on this panel? The trees. Hundreds of them. Each one had to be individually coloured. It took ages. By the time I was done, I didn’t have the energy to count them all. So I did something I rarely do, and asked an AI for help. I turned off all the Photoshop layers except for the trees, uploaded the file to ChatGPT, and asked it to count the distinct marks in the layer. Its answer: 7,488 trees. That’s how many I coloured in.
The beauty of building these maps up as separate Photoshop layers is that I can now get actual data from the pretty images. Within seconds, I was able to find out how many trees Rocque depicted in this part of town. I could do the same for all the other panels, and suddenly we would be able to rank the different districts of Georgian London in order of tree population. The absolute numbers are, of course, far from reliable. Rocque would not have sketched in every tree. Nothing like. But we can probably assume that the relative numbers across the 24 panels can be compared. Neighbouring Finsbury, for example, has 6,176 trees. “Further research needed.” as we used to say in the science publishing world of my first career.
(Incidentally, I never, ever use AI to help write my articles, but I think the occasional data-crunching task like this is a good use of the technology.)
The wider map
Before I leave you, here’s a low-res compilation showing all 10 of the 24 panels I’ve coloured in so far. 10 down, 14 to go… although many of the remaining panels are less urban, and thereby more swiftly behued.
The files I’m working with are about 50 cm by 70 cm. That means the entire map, if printed out, would be four metres wide and over two metres tall. You can see why it’s taking many months to colour in! Any galleries or museums reading this, with a suitably sized wall… I’d love to hear from you. It’s my ambition to get the complete map printed out and displayed somewhere, once complete.
Previous sections:
Southwark and the western City (plus the 50 lost waterways of Southwark)
London Bridge, Borough and the eastern City (plus the lost waterways of Borough)
Wapping and part of Bermondsey (plus lost roads of the East End)
Bloomsbury (plus its dehydration)
Clerkenwell and Smithfield (plus the lost places of Clerkenwell)
Barbican, Moorfields and Bishopsgate (plus Who was this John Rocque fellow anyway?)
Thanks for reading! As ever, please do leave a comment below if you’ve spotted something curious in the map, or even if you have fond memories of this part of town. Or email me any time on matt@londonist.com
Matt. You deserve congratulations after each and every section completion. So ..congratulations... and bon chance for all the continued behueing of all the remaining geography.
A remarkable labour of love. I work in archives down here in Devon and we have a coloured copy of Rocque’s map of Exeter, which I’ve always assumed was original, indicating that some colour copies were printed.
Rocque himself was a Huguenot, of course.